Talk To Anthony - Call (951) 202-2303

Pending Home Sales Fall 6%, Largest Drop in Nearly a Year

High housing costs and seasonal slowdown are prompting both buyers and sellers to pause.
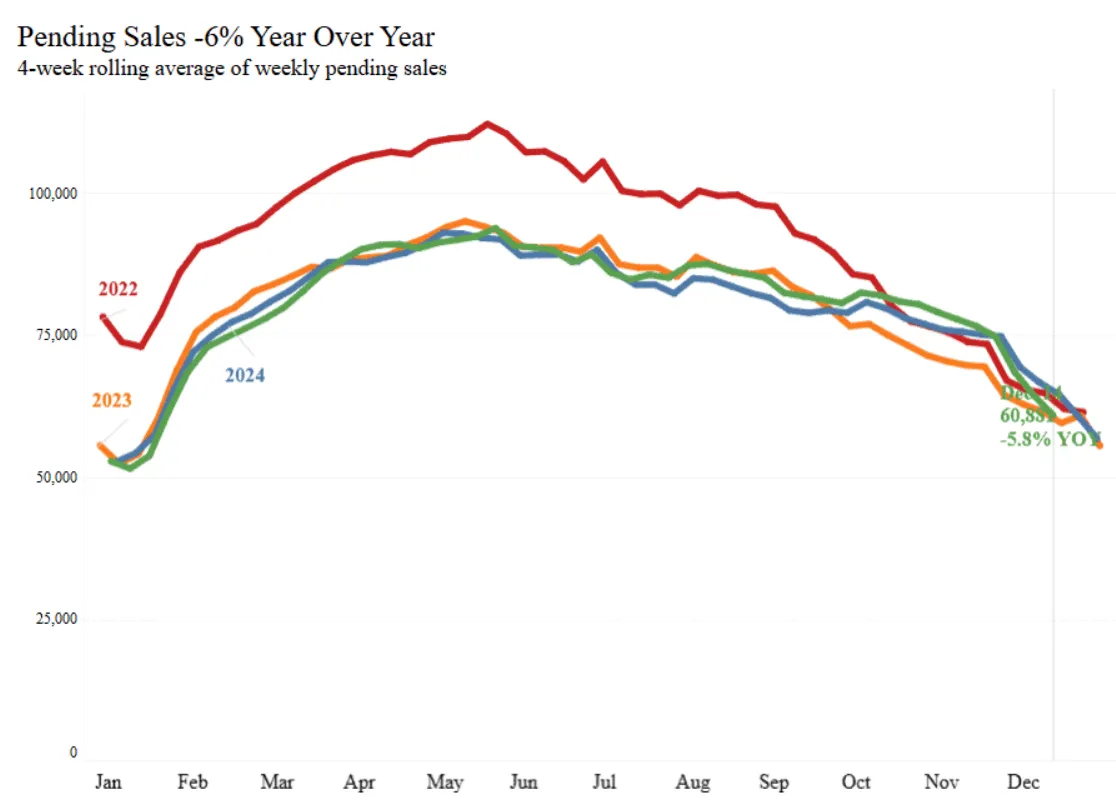
U.S. pending home sales dropped 5.8% year over year during the four weeks ending December 14, marking the largest decline since early 2025. Across major metro areas, pending sales fell in 44 of the 50 largest U.S. metros, with the steepest drops in San Jose, CA (-35.1% YoY), Houston (-20.9%), and Oakland, CA (-17.6%).
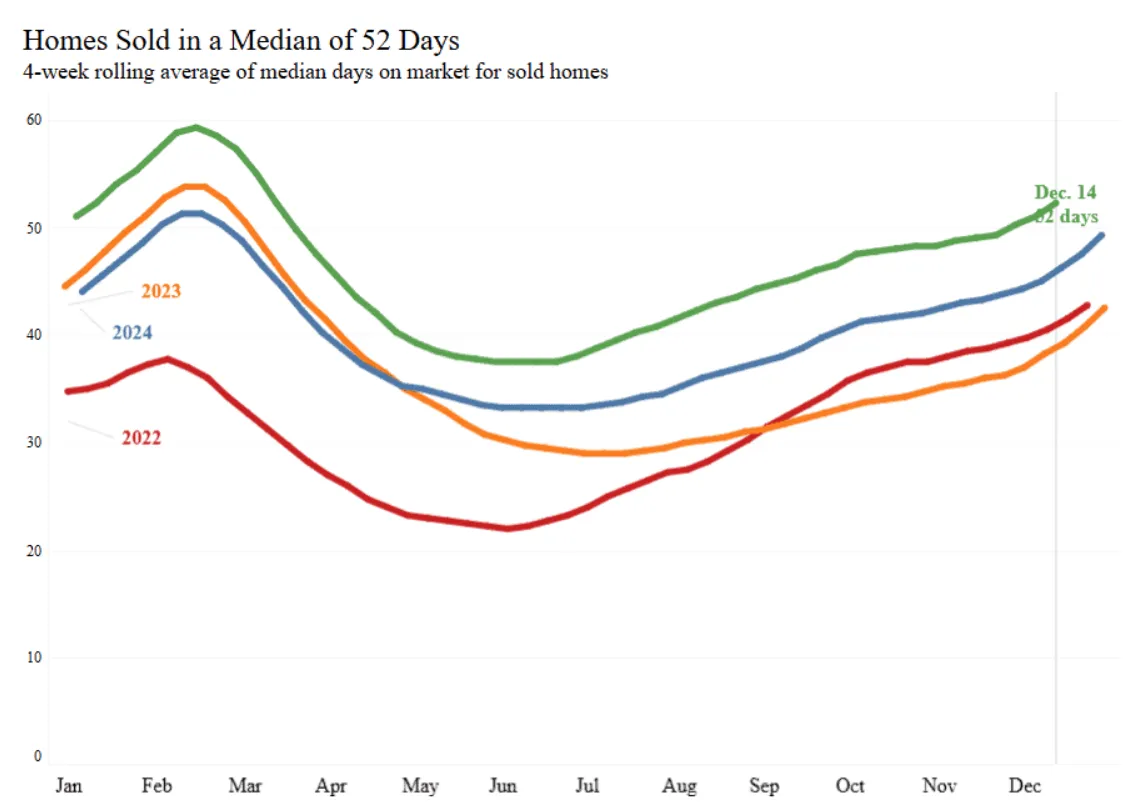
Homes that do sell are taking longer to go under contract. The typical U.S. home now spends 52 days on the market—about a week longer than last year.
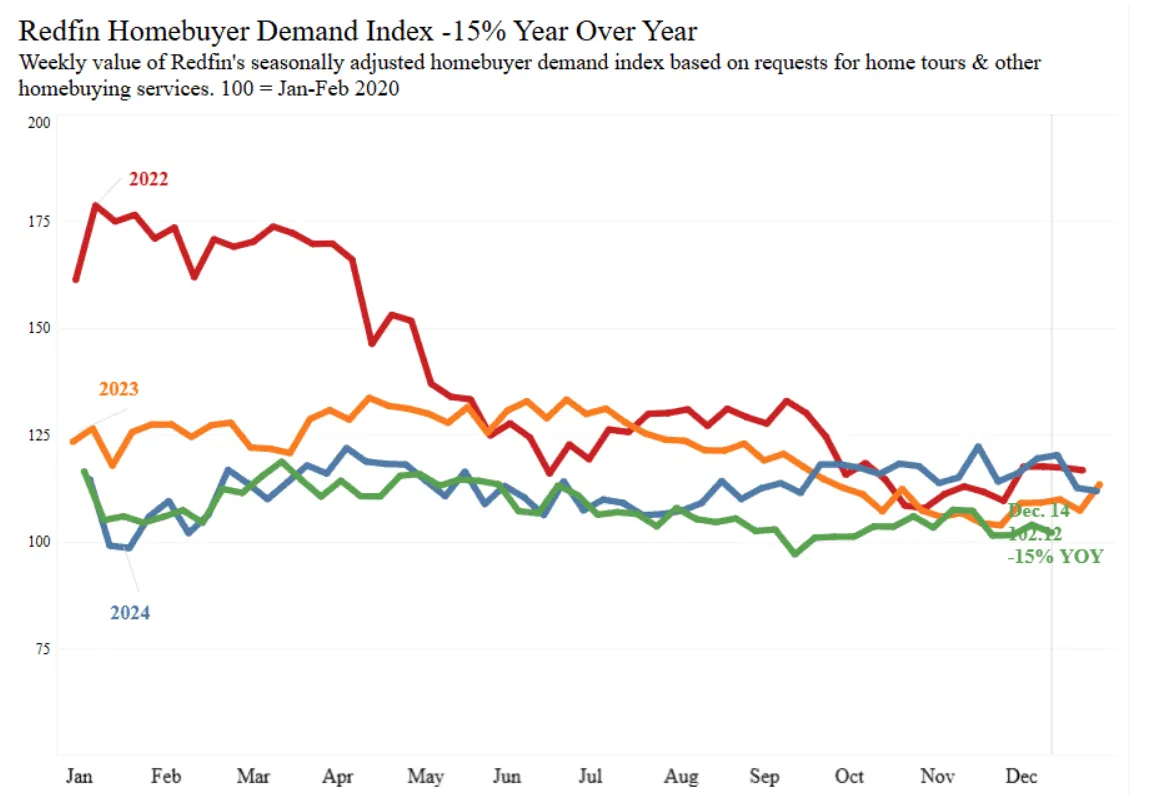
Buyers remain cautious this holiday season. Mortgage rates above 6% and rising home prices are putting many homes out of reach. Some are also waiting for clearer economic signals amid concerns about job security and signs of a weakening labor market. Pending sales are lower than last year, which had seen a surge in homebuying following the 2024 presidential election uncertainty.
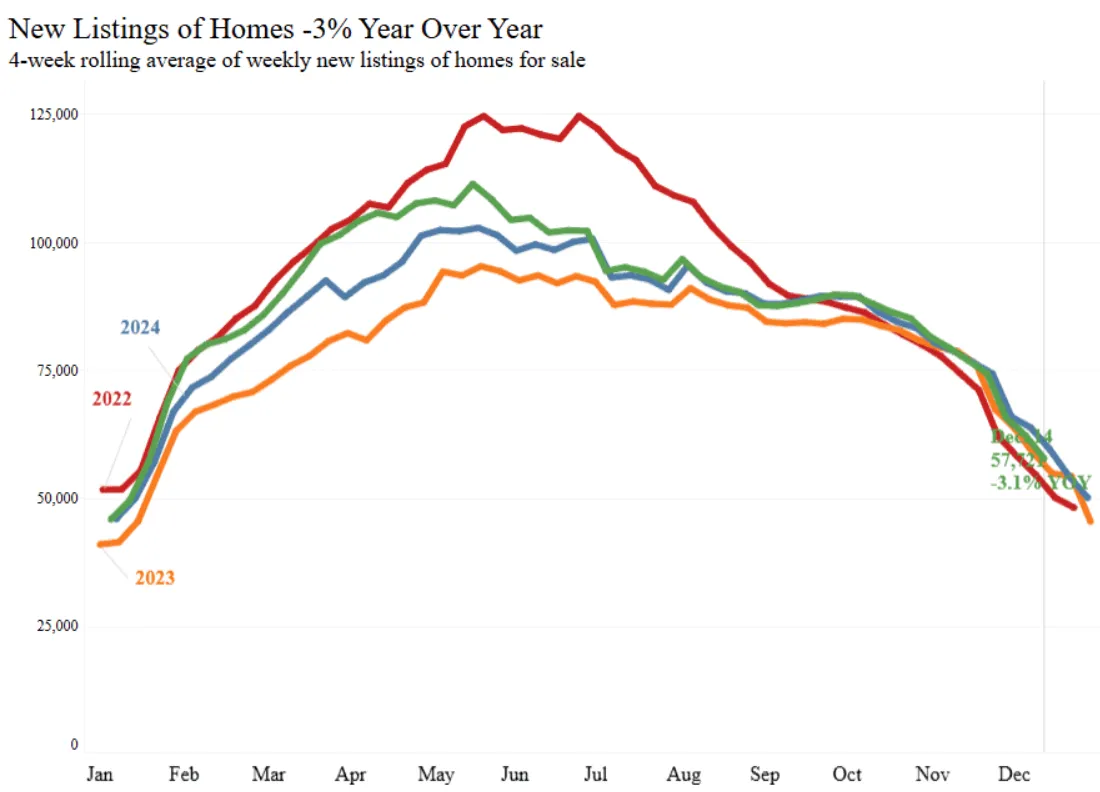
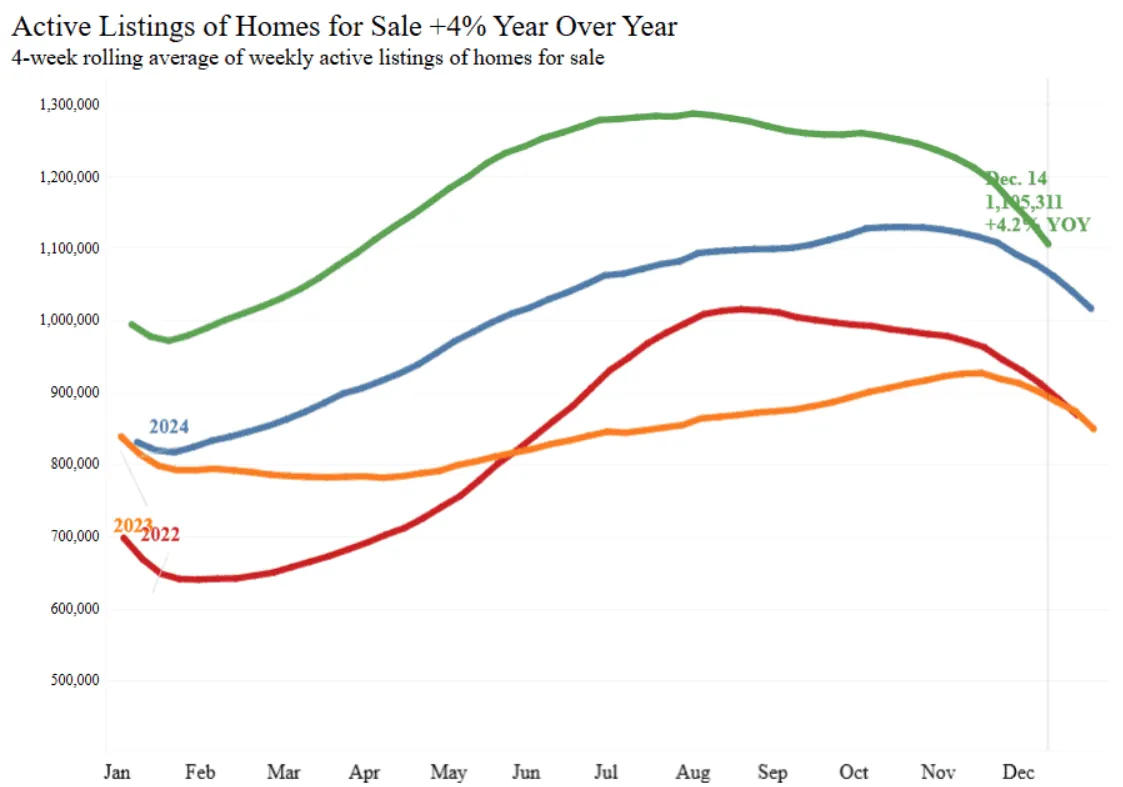
Slower buyer demand is affecting sellers as well. New listings fell 3.1% year over year—the largest drop in over two years—while active listings rose only 4.2%, the smallest increase since early 2024. Many potential sellers are holding off until market conditions improve in the new year.
Key Housing Indicators:
-> Daily average 30-year fixed mortgage rate: 6.27% (Dec. 17), down from 6.36% a week earlier and 6.93% a year ago.
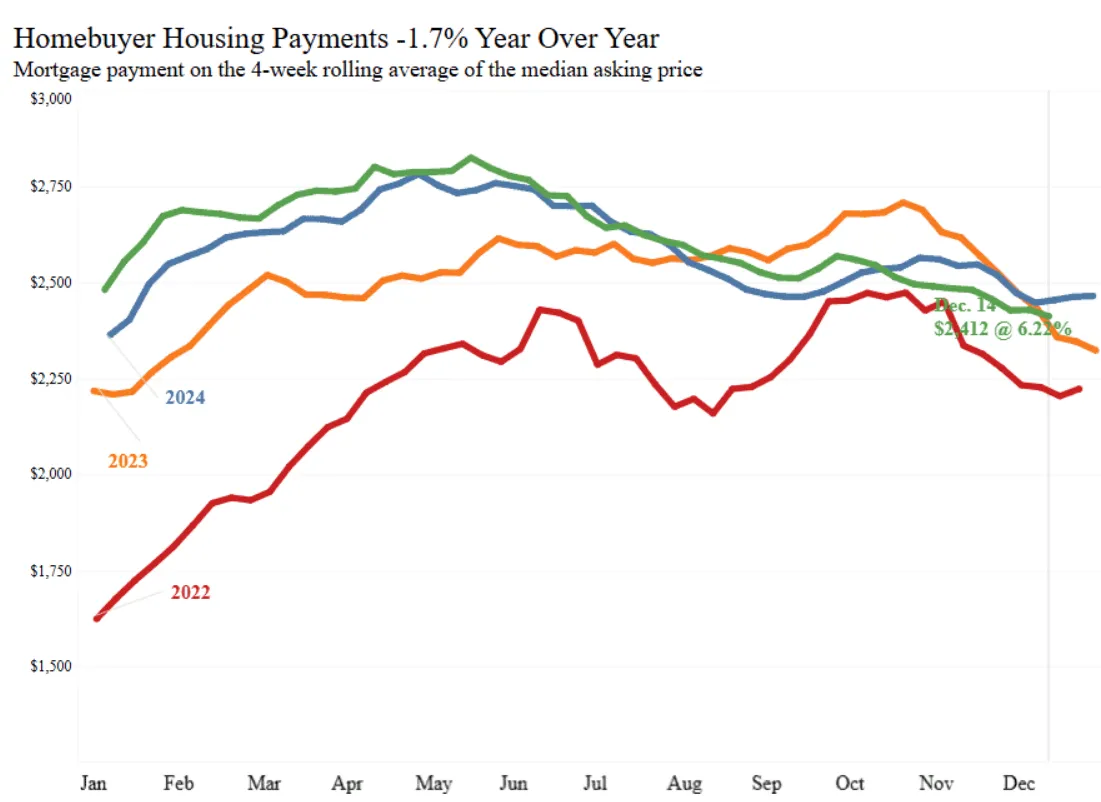
-> Weekly average 30-year fixed mortgage rate: 6.22% (week ending Dec. 11), near a 14-month low.
-> Mortgage-purchase applications: Down 3% from the previous week, up 13% YoY.
-> Google searches for “homes for sale”: Down 9% from last month, up 10% YoY.
-> Touring activity: Down 19% from the start of the year, consistent with seasonal trends.
U.S. Market Snapshot (Four weeks ending Dec. 14, 2025):
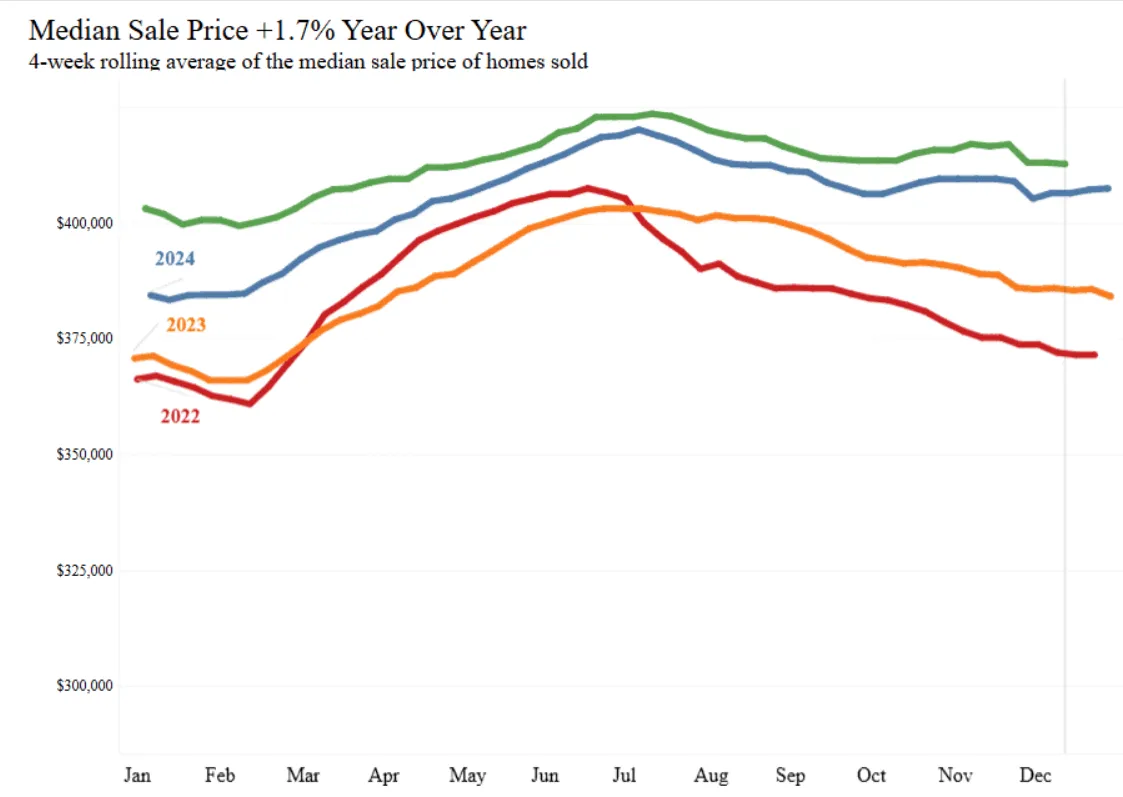
->Median sale price: $387,725 (+1.7% YoY)
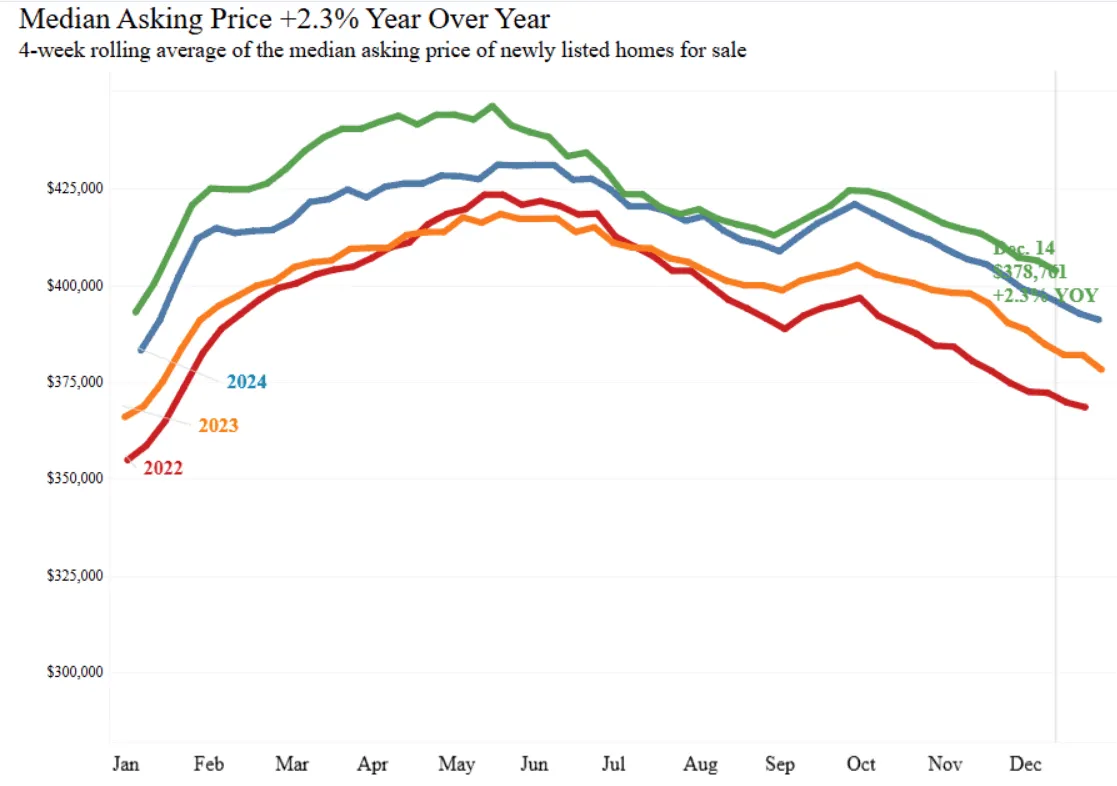
->Median asking price: $378,761 (+2.3% YoY)
->Median monthly mortgage payment: $2,412 (-1.7% YoY)
->Pending sales: 60,881 (-5.8% YoY)
->New listings: 57,721 (-3.1% YoY)
->Active listings: 1,105,311 (+4.2% YoY)
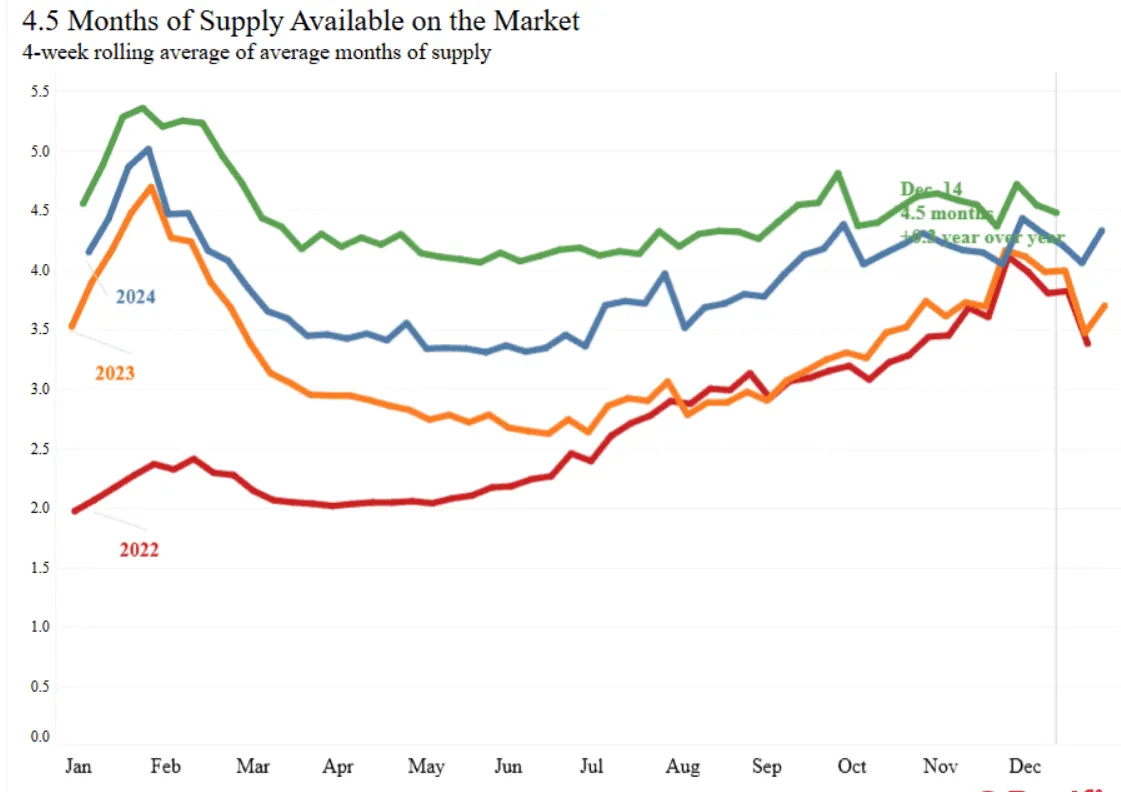
->Months of supply: 4.5 (+0.3 points)
->Median days on market: 52 (+6 days)
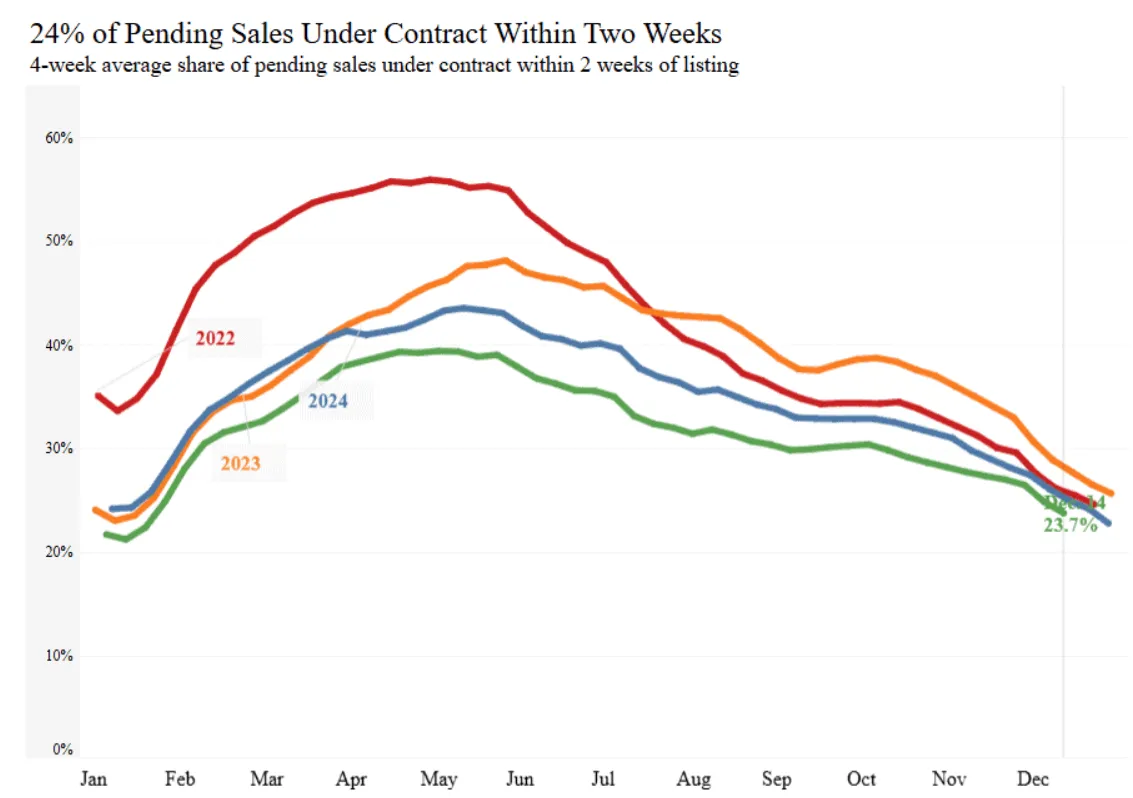
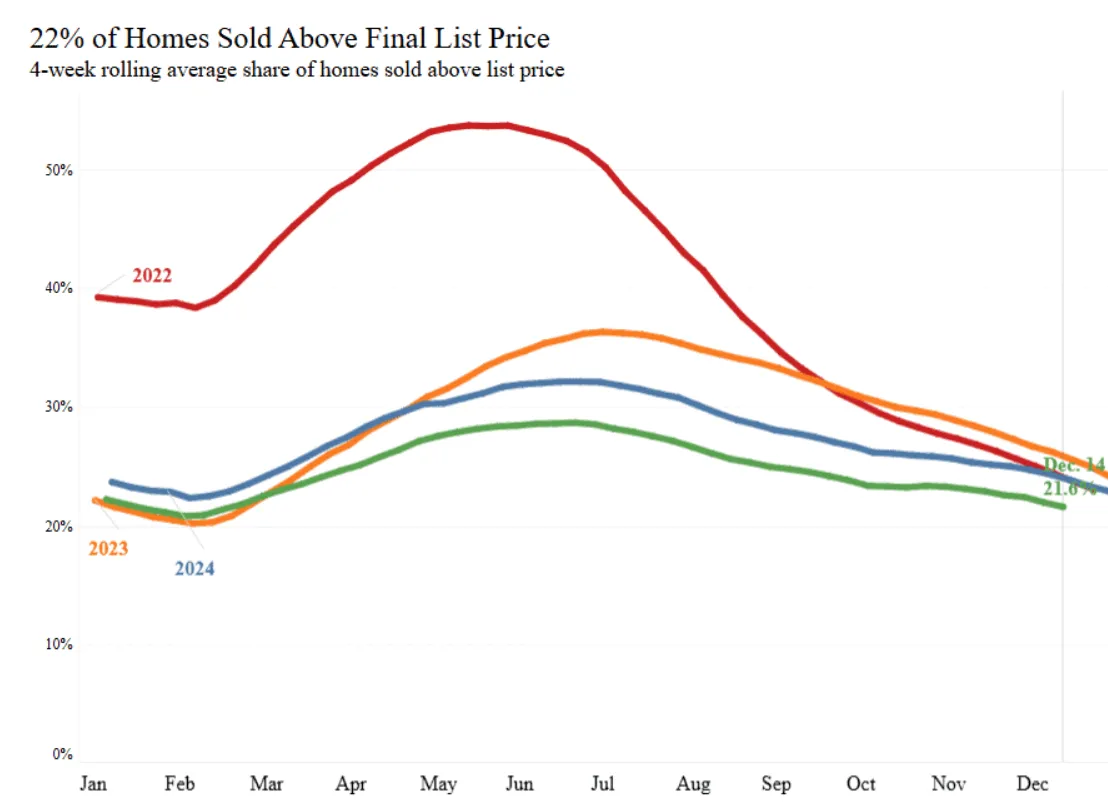
->Share of homes sold above list price: 21.6% (down from 24%)
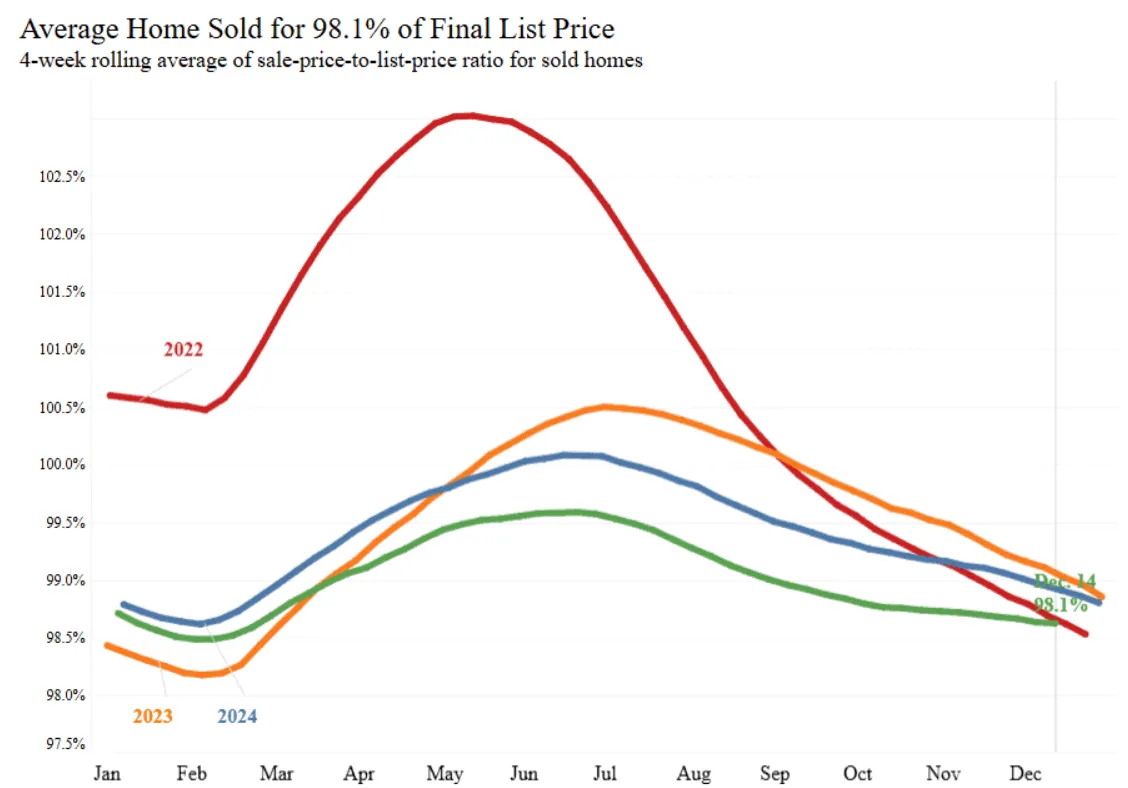
->Average sale-to-list price ratio: 98.1% (down from 98.4%)
Metro Highlights:
->Largest YoY median sale price gains: Detroit (+14.5%), Pittsburgh (+8.4%), Nassau County, NY (+7.4%), San Francisco (+7%), New Brunswick, NJ (+6.5%)
->Largest YoY median sale price declines: Dallas (-6.8%), Sacramento (-4.5%), Austin (-4.1%), Oakland (-3.9%), Seattle (-3.1%)
->Biggest pending sales increases: West Palm Beach (+10.7%), Virginia Beach (+6.5%), Miami (+6.4%), Boston (+5%), Pittsburgh (+1.7%), Phoenix (+0.7%)
->Biggest pending sales declines: San Jose (-35.1%), Houston (-20.9%), Oakland (-17.6%), Tampa (-17.3%), Denver (-16.3%)
->Biggest new listings increases: Boston (+5.3%), San Diego (+5.2%), Philadelphia (+5.1%), Cleveland (+5%), San Francisco (+4.7%)
->Biggest new listings declines: San Antonio (-21.4%), Tampa (-18.4%), Jacksonville (-14.6%), Fort Lauderdale (-13.6%), West Palm Beach (-13.5%)
Get In Touch
(951) 202-2303
2514 S. Hacienda Blvd. Ste. A
Hacienda Heights, Ca 91745
Meet Your Agent

Anthony Solomon